Hyperledger Explorer screens
Login screen
When user navigates to the home page of Hyperledger Explorer or enters default url http(s)://<host>:<port>, initially the login screen will be displayed to select the Network Name, and enter the user, and password based on the configuration in order to access the dashboard page.
Important
Expiration time of the JWT token, can be configured and by default is set to two hours.
Dashboard
Dashboard is the home page of the Hyperledger Explorer, and displays a set of panels that will show the latest activity of the Hyperledger Fabric network the explorer is configured to. We can see the navigation tabs: DASHBOARD, NETWORK, BLOCKS, TRANSACTIONS, CHAINCODES, CHANNELS. Along with the navigation tabs there are: channel drop down, dark theme switch, and latest notification icons. List of the peers can be seen, metrics, followed by latest activity, and transactions by organization panels. Each panel reflects the historical, metrics, and the latest activity per selected channel.
Note
To see another channel latest activity, select another channel from the drop down list.
Latest blocks notification panel
The latest block notification panel displays the block number, channel name, datahash, and the number of transactions per block. There is an icon link to show the latest block details, and is located in the right most corner of the panel. In the picture below you can see the block details accessed from the provided link.
Dark theme screen
The dark theme mode is another view of the Hyperledger Explorer, there can be some potential benefits by switching to it.
Block list
Block list displays a list of the block attributes, and links to block, and transaction pop up details window. Please notice when mouse over it will display the actual block hash. Displayed in a table all the headers are sortable either descending or ascending depending of the direction selected. A filter can be applied to search by date range, and selected organization from the list.
Block details window
This screen represents in detail a block. You can see the creation of the block, number of transactions in this block, block hash, data hash, and the previous hash that connects to the previous block. For usability you can copy any of the hashes using the clipboard icon.
Filter result
By default block list will return one day woth of data, but you can modify the search criteria to search historical data, and apply also filter to the returned result. List can be sorted by one of desired direction, ascending or descending. To clear the global filter you can use the Clear Filter button. The Reset button can be used to reset the date range, and the organizations selection.
Transaction list
Transaction list screen has almost identical functionality as the block list screen, the number of rows per page, up to 100, can be selected from the drop down, next and previous buttons allow to navigate the direction of results, back or forward.
Transaction details
Transaction details is similar to block details, JSON data can be folded/unfolded for the preview purposes.
Chaincode list
Chaincode list displays the chaincode properties and has filter, and sort functionalities. Displayed list is for the current selected channel.
Channel list
Channel list displays all the channels, and it’s properties, has similar filter, and sort functionalities as chaincode list.
Metrics
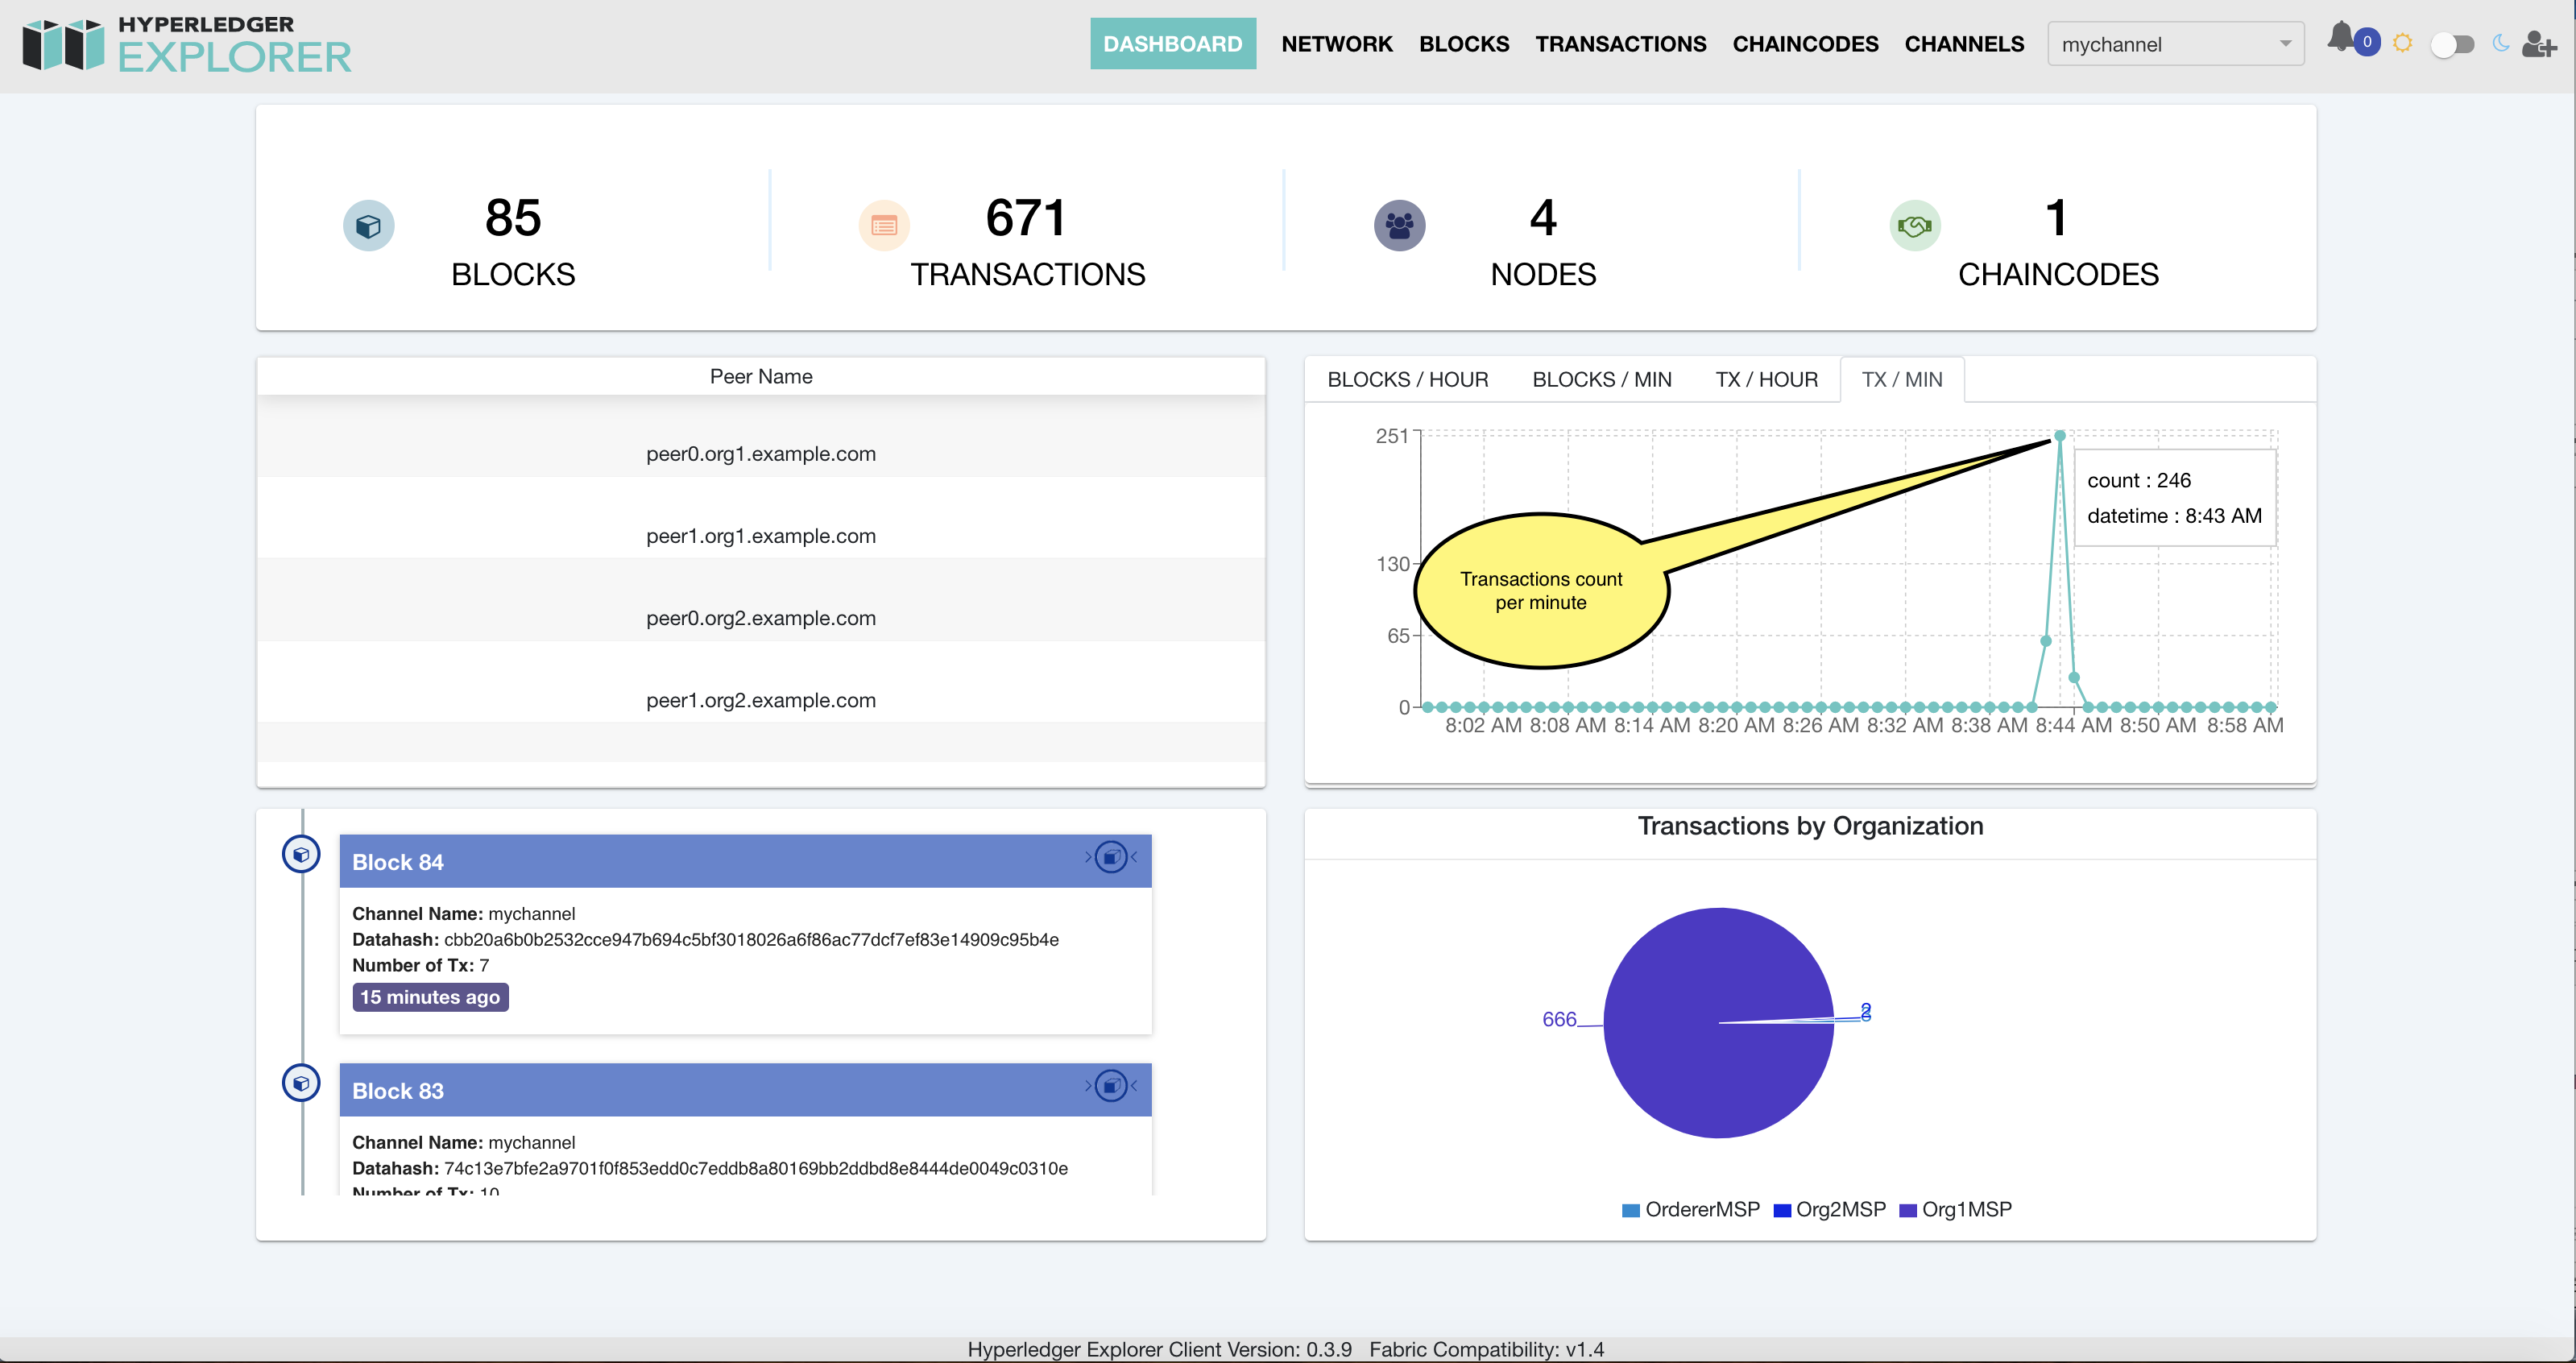
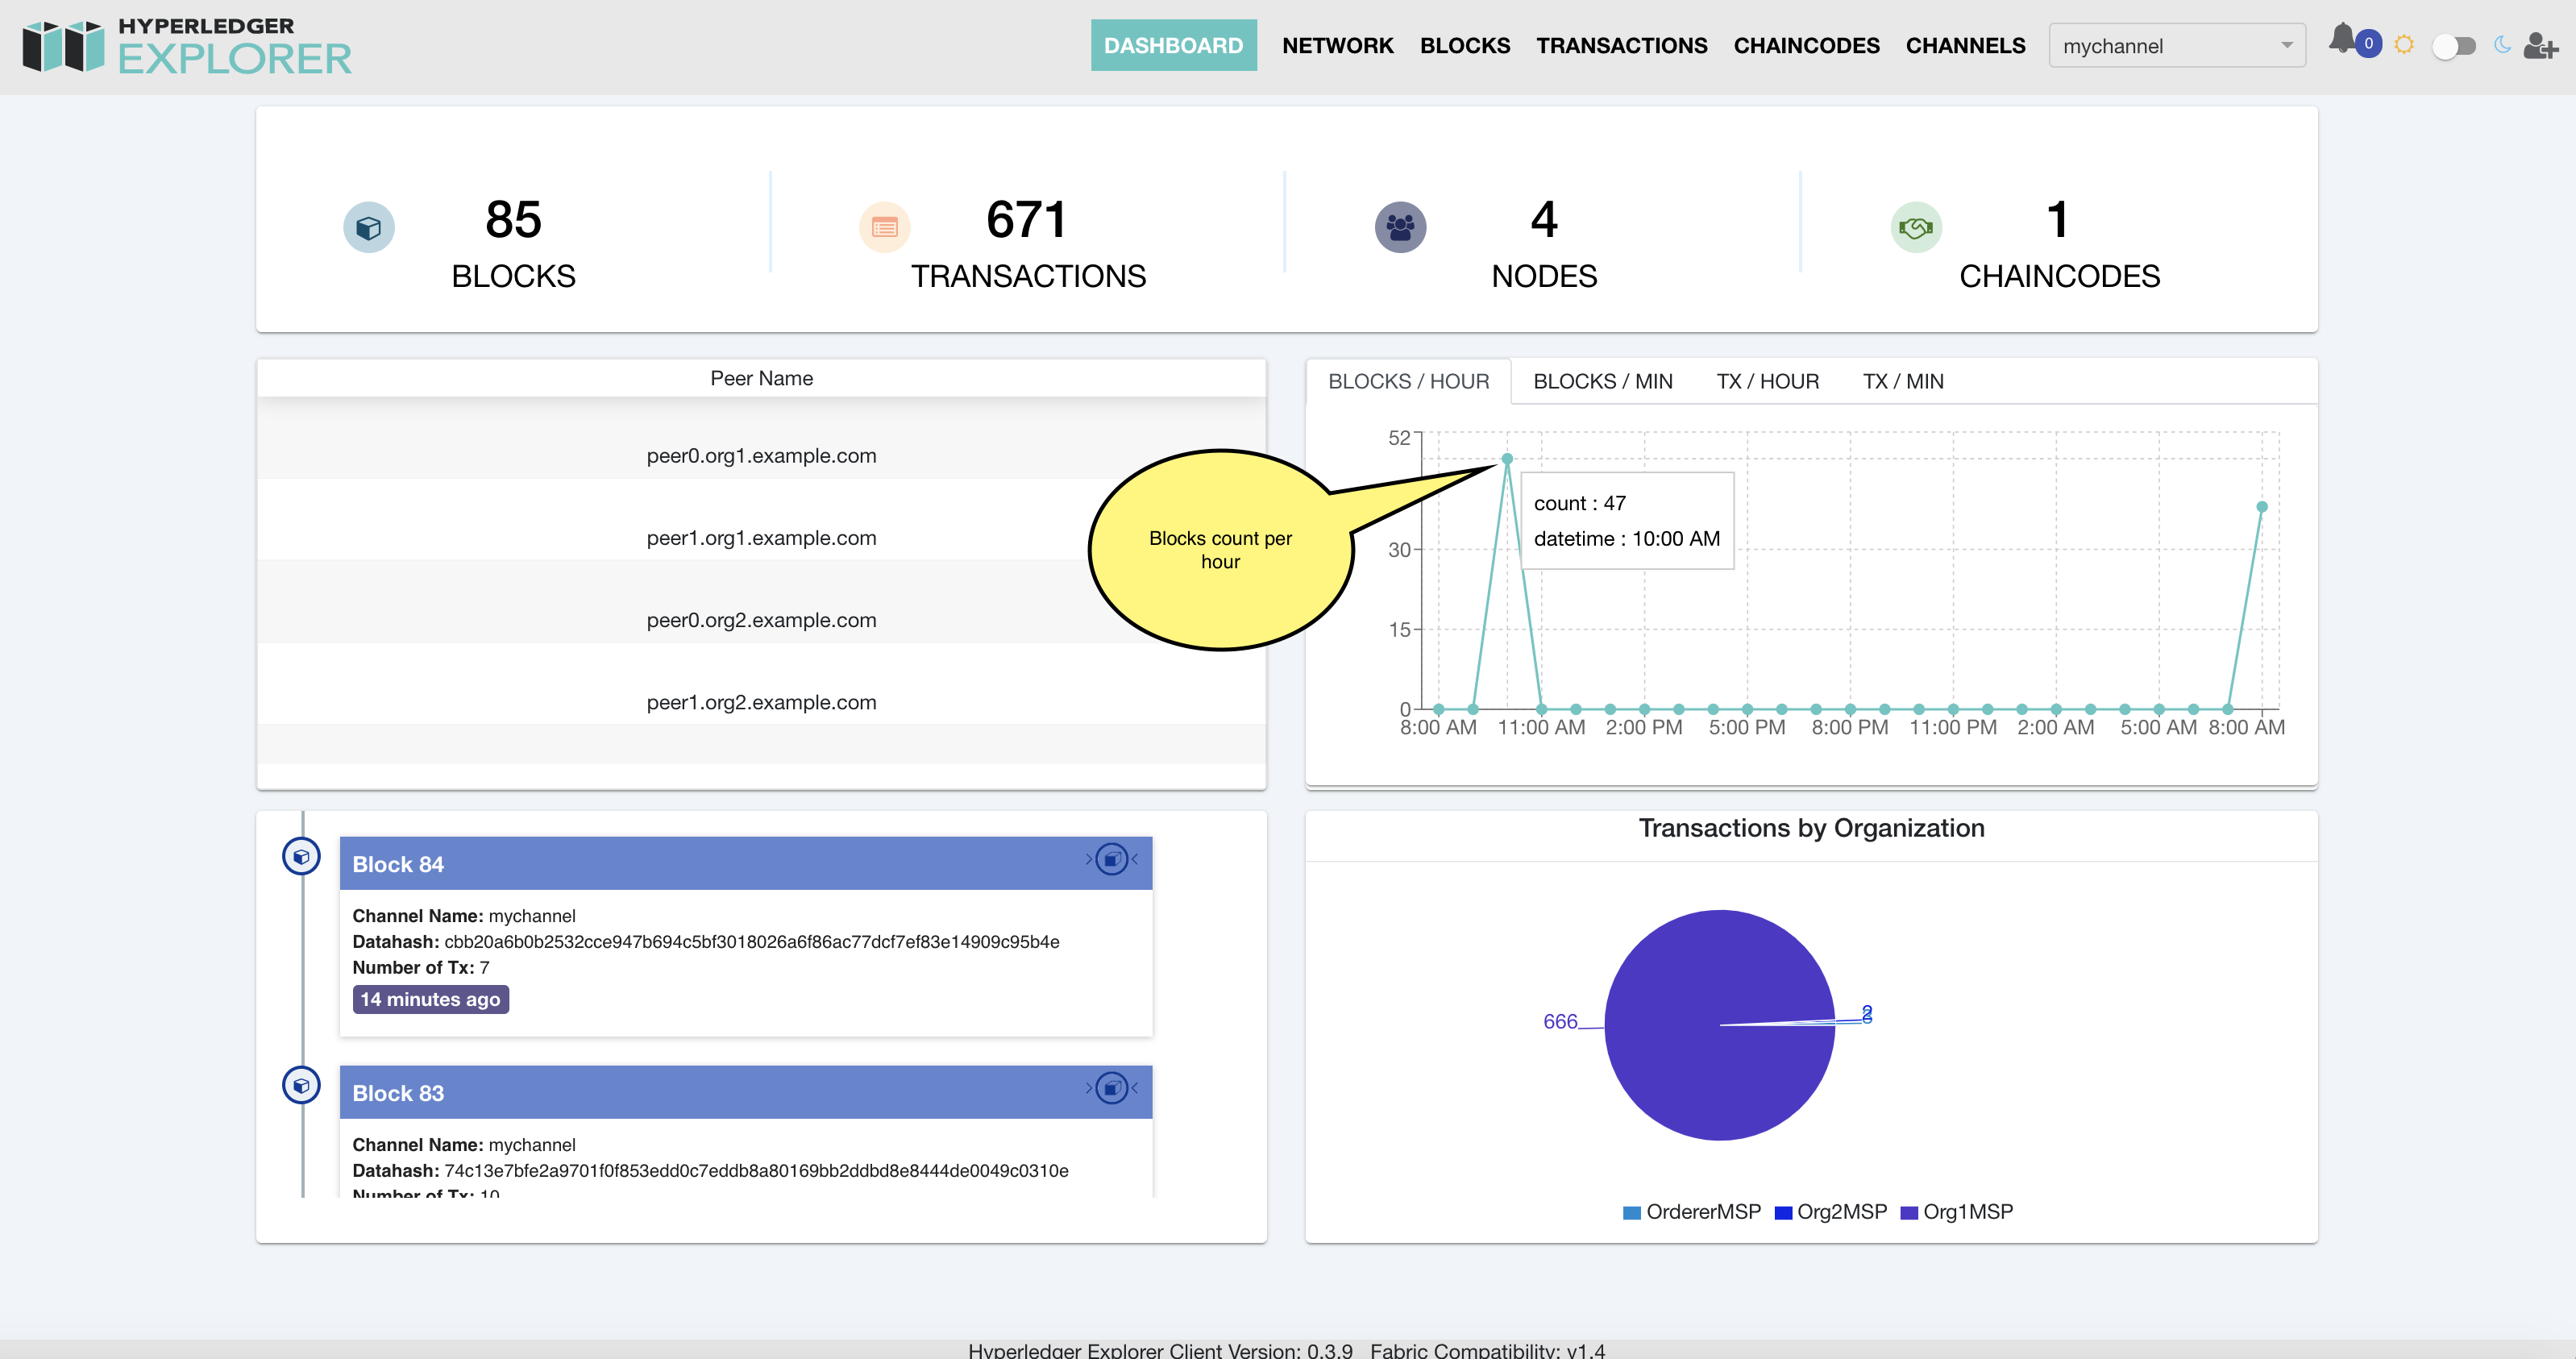
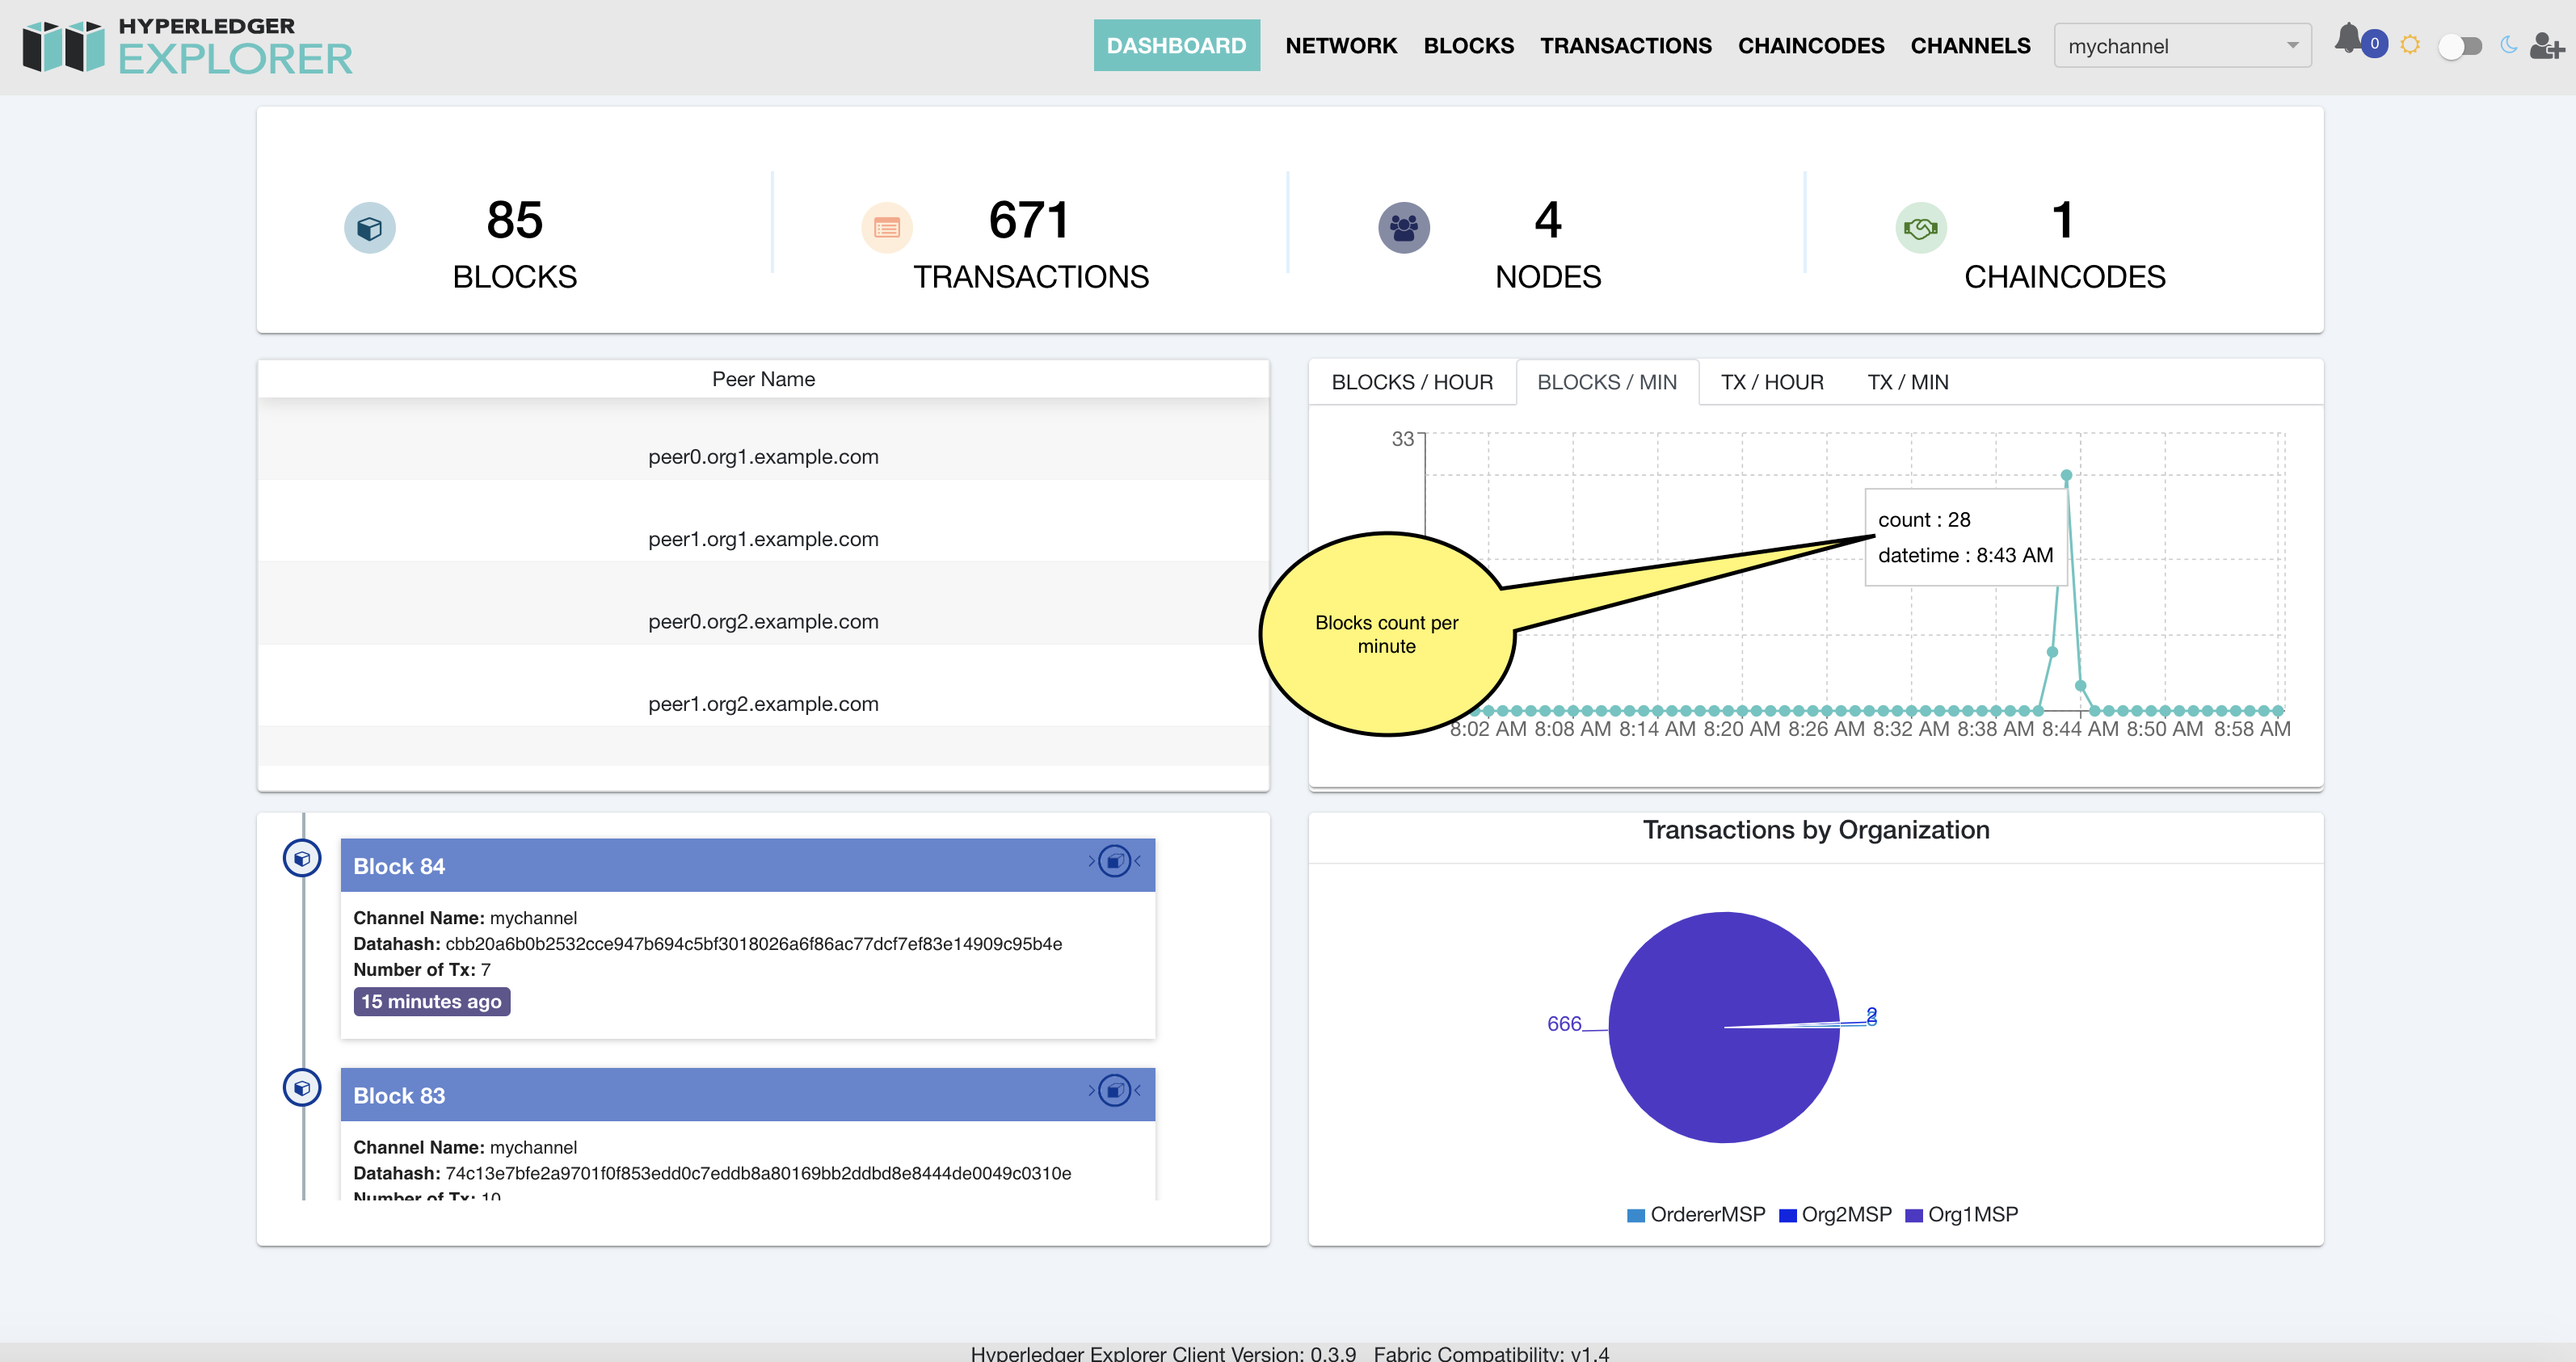
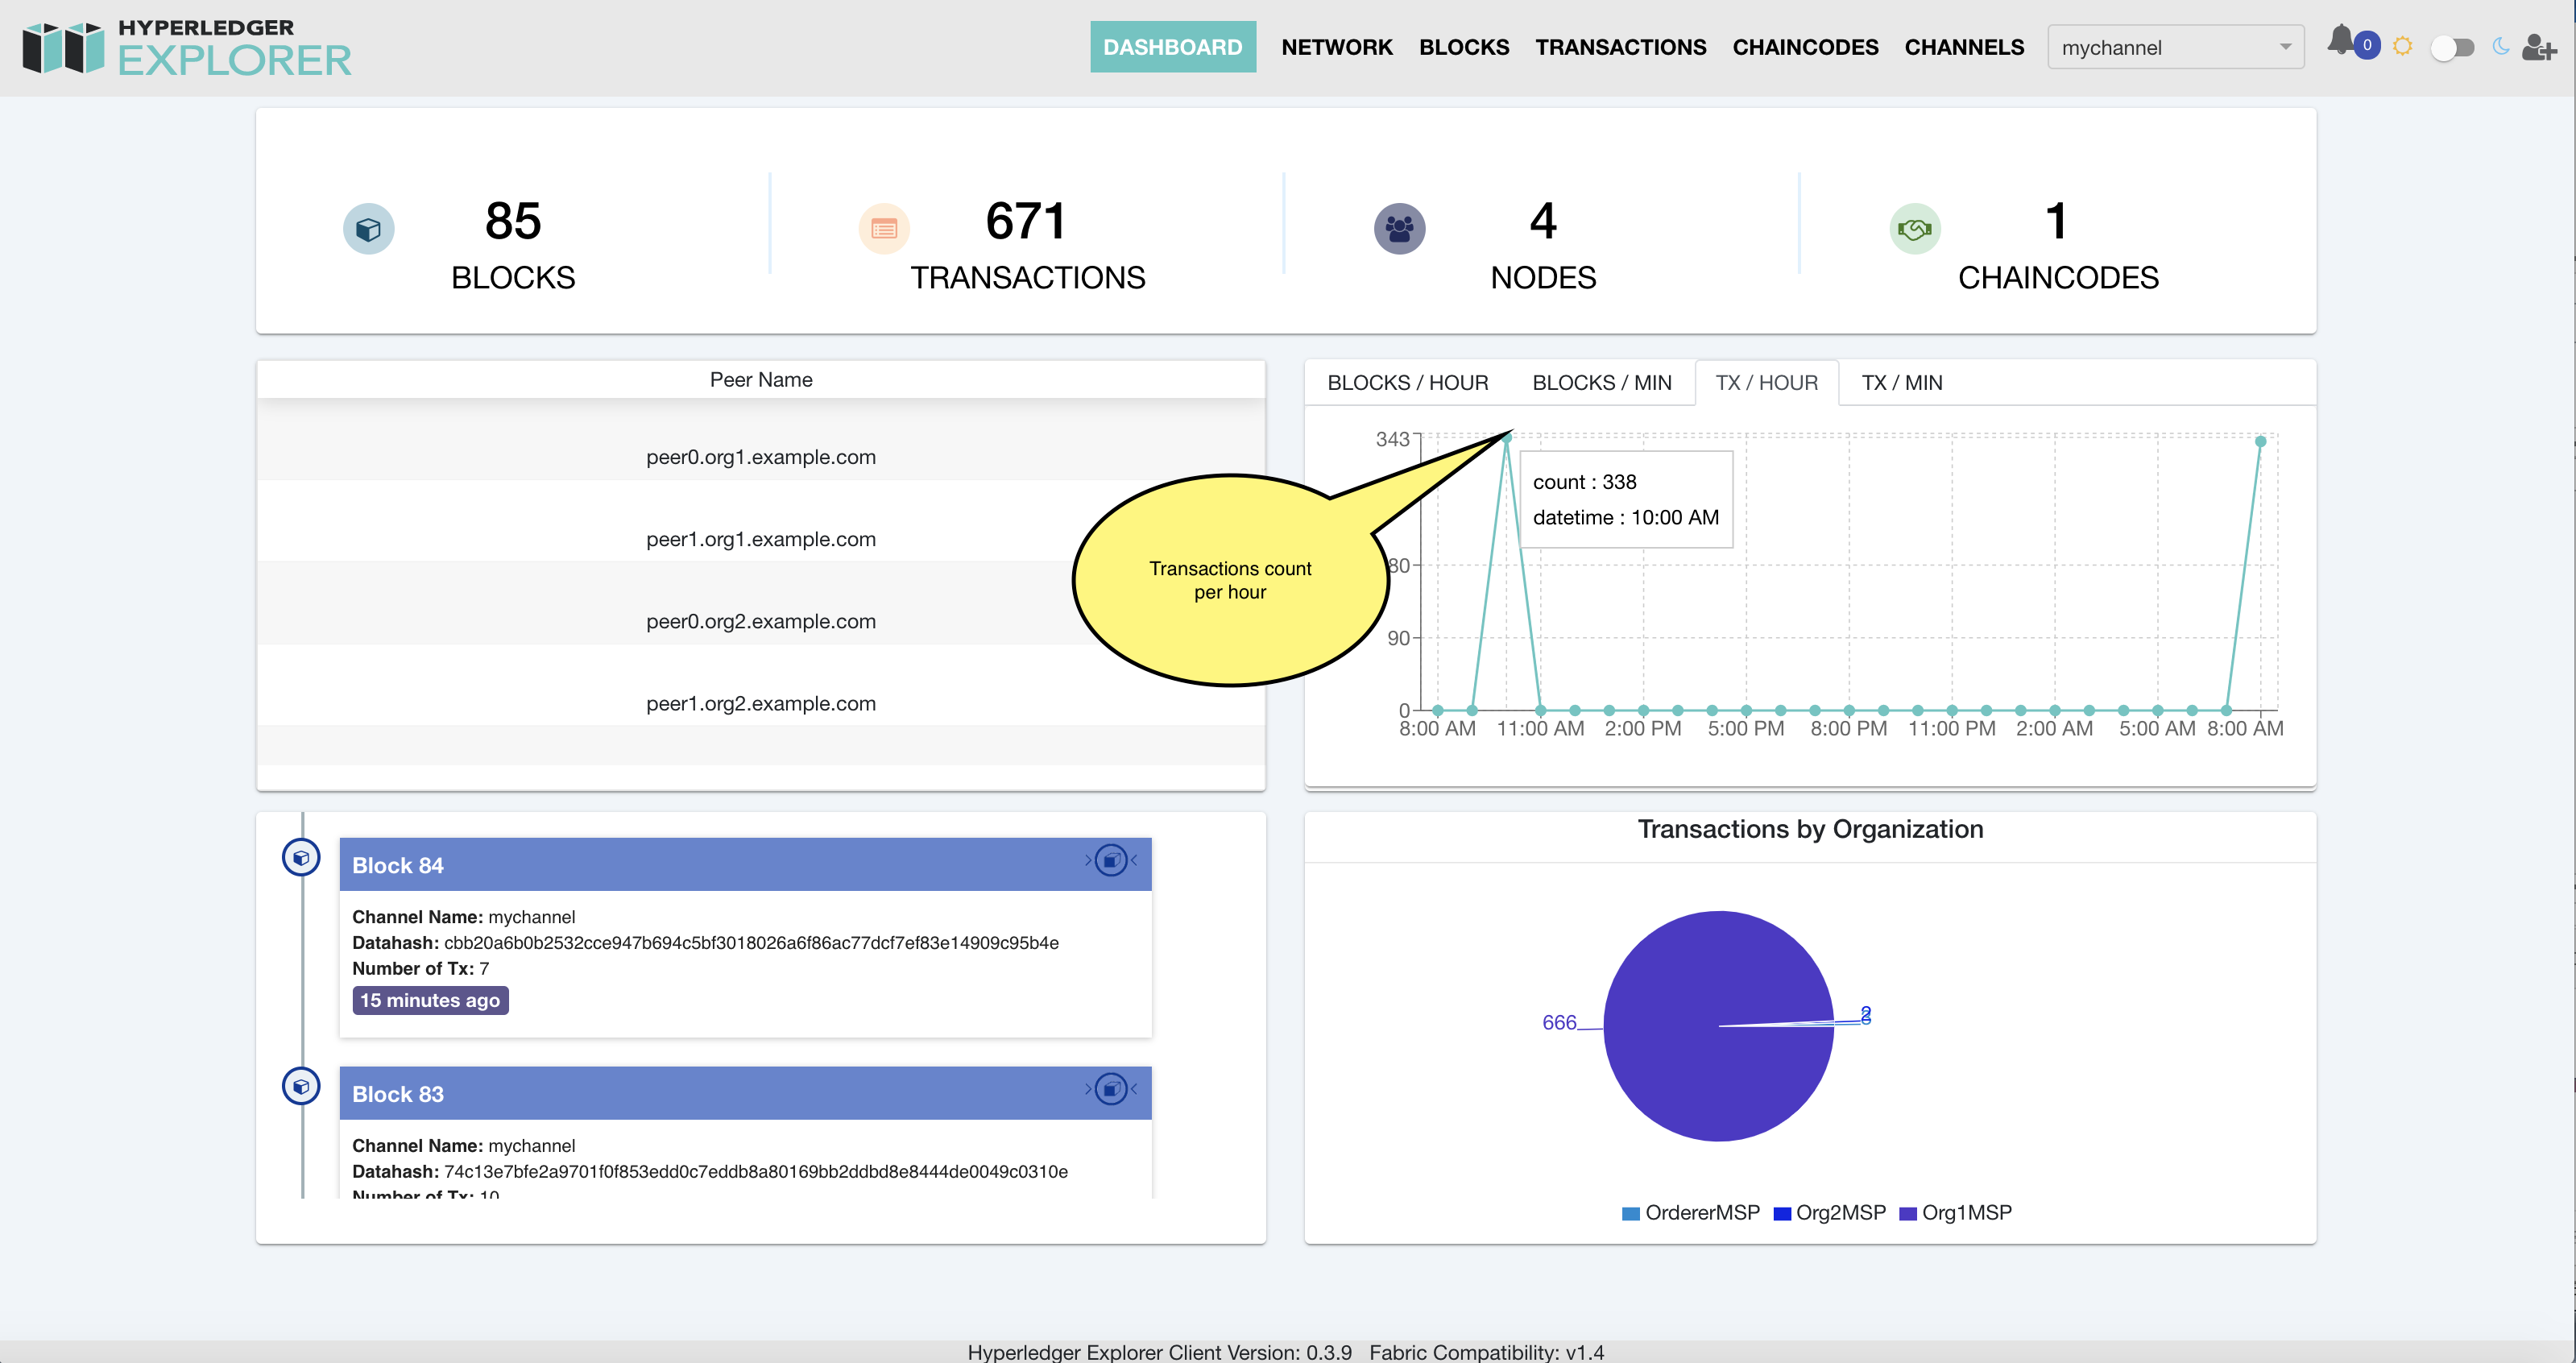
Metrics panel has four tabs that will show the latest statistics of blocks, and transactions per selected channel. By hovering mouse over at any point of intersection in the graph will show the counts per hour, or minute. Click on any tabs below to see the metrics per block/transaction, hours or minute.
Blocks per hour
Displays the number of blocks added to fabric network in that period.
Blocks per minute
The number of transactions added to fabric network in that period.
Transactions per hour
Displays the number of transactions added to fabric network in that period.
Transactions per minute
The number of transactions added to fabric network in that period.